
Implementing P-Dashboard centralized performance monitoring across multiple Volkswagen AG plants and central offices, allowing senior management to compare performance more effectively and identify areas for improvement.
The tool extended the existing Business Cockpit with advanced benchmarking, data visualization, and reporting features, improving performance management, increasing efficiency, and providing scalability for the organization’s further development.
Key points:
- Centralized monitoring: P-Dashboard monitors performance indicators in real time.
- Benchmarking: The dashboard compares performance across locations.
- Accessibility: The application works on desktops and tablets.
- Access management: Only authorized users can access the data.
- Reporting: Creating and exporting customized reports with visualizations.
P-Dashboard is a presentation and benchmarking tool designed to provide senior management with a comprehensive view of performance indicators across multiple manufacturing plants and central offices. It extends the existing Business Cockpit with advanced data visualization and reporting features focused on benchmarking performance across different locations and departments.
The client
Volkswagen AG is one of the world’s leading automotive companies, with a focus on innovation and manufacturing efficiency. As part of its activities, the company implemented the P-Dashboard application. The application allows management to compare performance across locations, improve performance management, and identify areas for improvement while supporting efficient reporting and high scalability.
The goals
The main implementation goals were:
- Performance benchmarking: Compare performance indicators across different plants and central offices, allowing management to evaluate results and identify areas for improvement.
- Centralized monitoring: Centralize monitoring of key performance metrics, giving users access to real-time data and efficient report generation.
- User accessibility: Make the dashboard accessible on different devices, particularly desktop computers and tablets, with optimal performance in supported browsers.
- Role-based access management: Implement secure access management so that data is available only to authorized users.
The solution: key features
- Benchmarking:
- P-Dashboard compares performance across different plants and central offices using key metrics, enabling focused comparisons to identify trends and deviations.
- Comprehensive data presentation:
- Users can monitor performance data for both plants and central offices and switch between detailed and summarized views using intuitive action buttons.
- Visualization indicators provide a quick view of status, with the option to open more detailed data for further analysis.
- Interactive user interface:
- The dashboard includes interactive elements that allow users to navigate between reports, select specific time periods, and export data as PDF files.
- Multilanguage support makes the application suitable for a global user base.
- Administrative controls and role-based access:
- P-Dashboard includes an administrative module for managing profiles, cost centers, and other key settings.
- System access is managed by role, ensuring that only authorized users can view or modify specific data and supporting data security and integrity.
- Responsive design:
- The dashboard is responsive and provides optimal display and usability on desktop and mobile devices.
- The application supports different display resolutions and is optimized for specific browsers and high-resolution iPad displays.
- Advanced reporting and exports:
- Users can create customized reports based on selected indicators, time periods, and locations. Reports can be exported as PDF files for offline analysis and sharing.
- The system includes features for refreshing calculation caches so that users always have access to the latest data.
Implementation challenges
- Data integration and consistency: Integrating data from Business Cockpit and maintaining consistent updates across regions and departments was essential for accuracy.
- User interface design: The interface needed to meet the needs of both technical and nontechnical users while remaining consistent across all devices.
- Role-based access management: The implementation required a secure and flexible access management system capable of handling diverse user roles and responsibilities across regions and departments.
Benchmarking and analytics features
- Comparison across plants and central offices:
- P-Dashboard allows users to compare performance metrics across different locations, providing detailed comparisons of performance indicators.
- Benchmarking helps identify best practices and areas for improvement, supporting the organization’s operational efficiency.
- Data visualization for strategic insights:
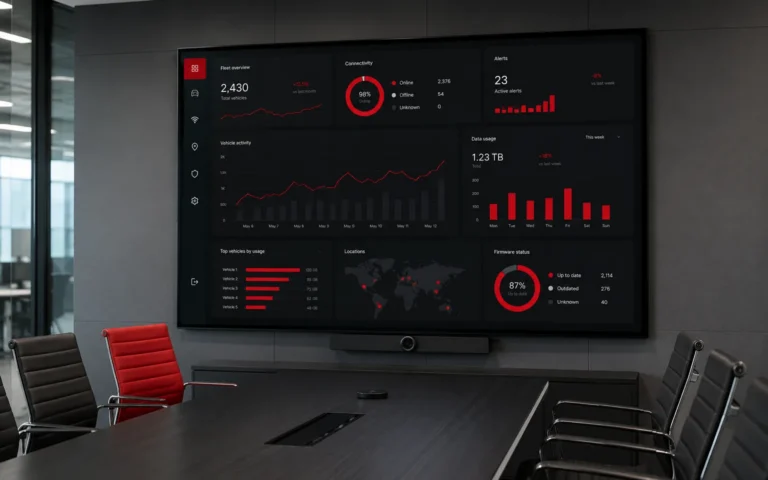
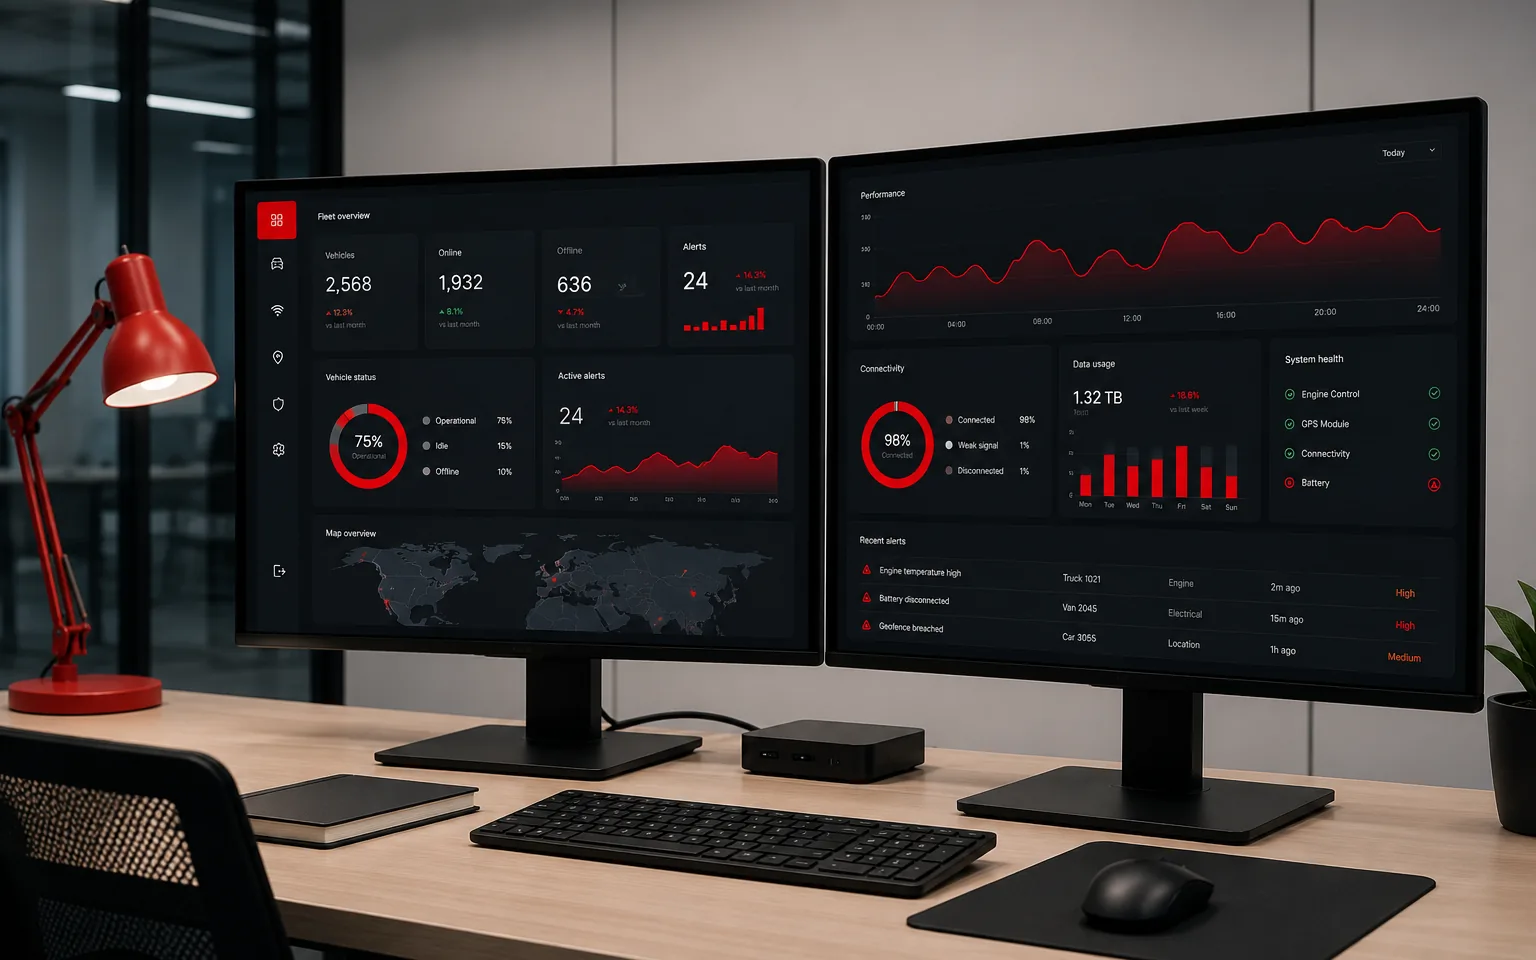
- The dashboard provides visual representations of data such as charts and diagrams, making it easier to compare performance across different entities.
- These visualizations support strategic decision-making by highlighting trends and deviations that may not be apparent in unstructured data.
Results and impact
- Improved performance management: P-Dashboard’s benchmarking capabilities improved performance management across plants and central offices by providing actionable insights from performance indicators.
- Greater efficiency: Centralized data monitoring and reporting features significantly reduced the time and effort required to compile and analyze performance data.
- Scalability and flexibility: P-Dashboard’s modular design supports straightforward updates and scaling, helping the application adapt to the organization’s changing needs.
Conclusion
P-Dashboard provides not only a centralized platform for performance monitoring but also powerful benchmarking tools that improve management across the organization. Its successful implementation demonstrates the important role of technology in increasing efficiency and supporting informed decision-making.