
Key points:
- VWGS implemented a monitoring dashboard for better management of its IT services
- A single centralized view allows incidents to be identified and resolved more quickly
- More accurate incident classification and fewer incorrect escalations
- A proactive approach to problem solving reduces service outages
- A dedicated Grafana dashboard gives a complete view of the IT infrastructure
- Extended monitoring of external services improves control over IT operations
- Greater operational efficiency and higher customer satisfaction thanks to more stable services
Managing IT infrastructure in the automotive industry is essential to keeping operations running and reducing the risk of outages. Companies face growing system complexity, the need to respond to incidents quickly, and the requirement for continuous service availability. Standard monitoring tools often do not provide enough visibility, which makes problems harder to resolve and increases the risk of downtime.
The current trend is toward advanced monitoring solutions that offer a centralized view of the infrastructure, rapid problem detection, and proactive incident management. These tools bring data from different sources together and give both management and technical teams an immediate picture of the state of critical systems.
The client
Volkswagen Group Services Slovakia is a key IT service provider within the Volkswagen group. The company supports a broad range of technology needs, from infrastructure management to the development of specialized applications. With an extensive network of connected systems and services, VWGS plays a central role in keeping IT operations running smoothly across the whole Volkswagen group.
The challenges
VWGS faced several serious challenges in monitoring and managing its IT services. The main problem was insufficient visibility into the state of individual services and the dependencies between them. That made it difficult to identify and resolve problems quickly, with a potential impact on service quality.
A further challenge was ineffective incident classification. The severity of problems was frequently overstated, which led to unnecessary escalations and inefficient use of resources. Support teams often lacked the information needed to route incidents correctly, which extended resolution times.
The complexity of the VWGS infrastructure, with its many interconnected systems and external services, made the situation harder still. Without a single view of that network, proactive management and prevention of potential problems were difficult.
Based on these challenges, VWGS set the following project goals:
- Create a centralized dashboard giving a real-time view of the state of all critical services and the dependencies between them.
- Improve the accuracy of incident classification and reduce the number of incorrectly escalated problems.
- Introduce a proactive approach to problem solving, allowing potential service outages to be identified and addressed quickly.
- Extend monitoring coverage to external services and systems that are critical to the VWGS infrastructure.
- Consolidate and integrate the existing monitoring tools into a single solution.
- Shorten the time needed to identify, assign, and resolve incidents.
- Give management a clear and immediate view of service status and of incidents in progress.
The solution
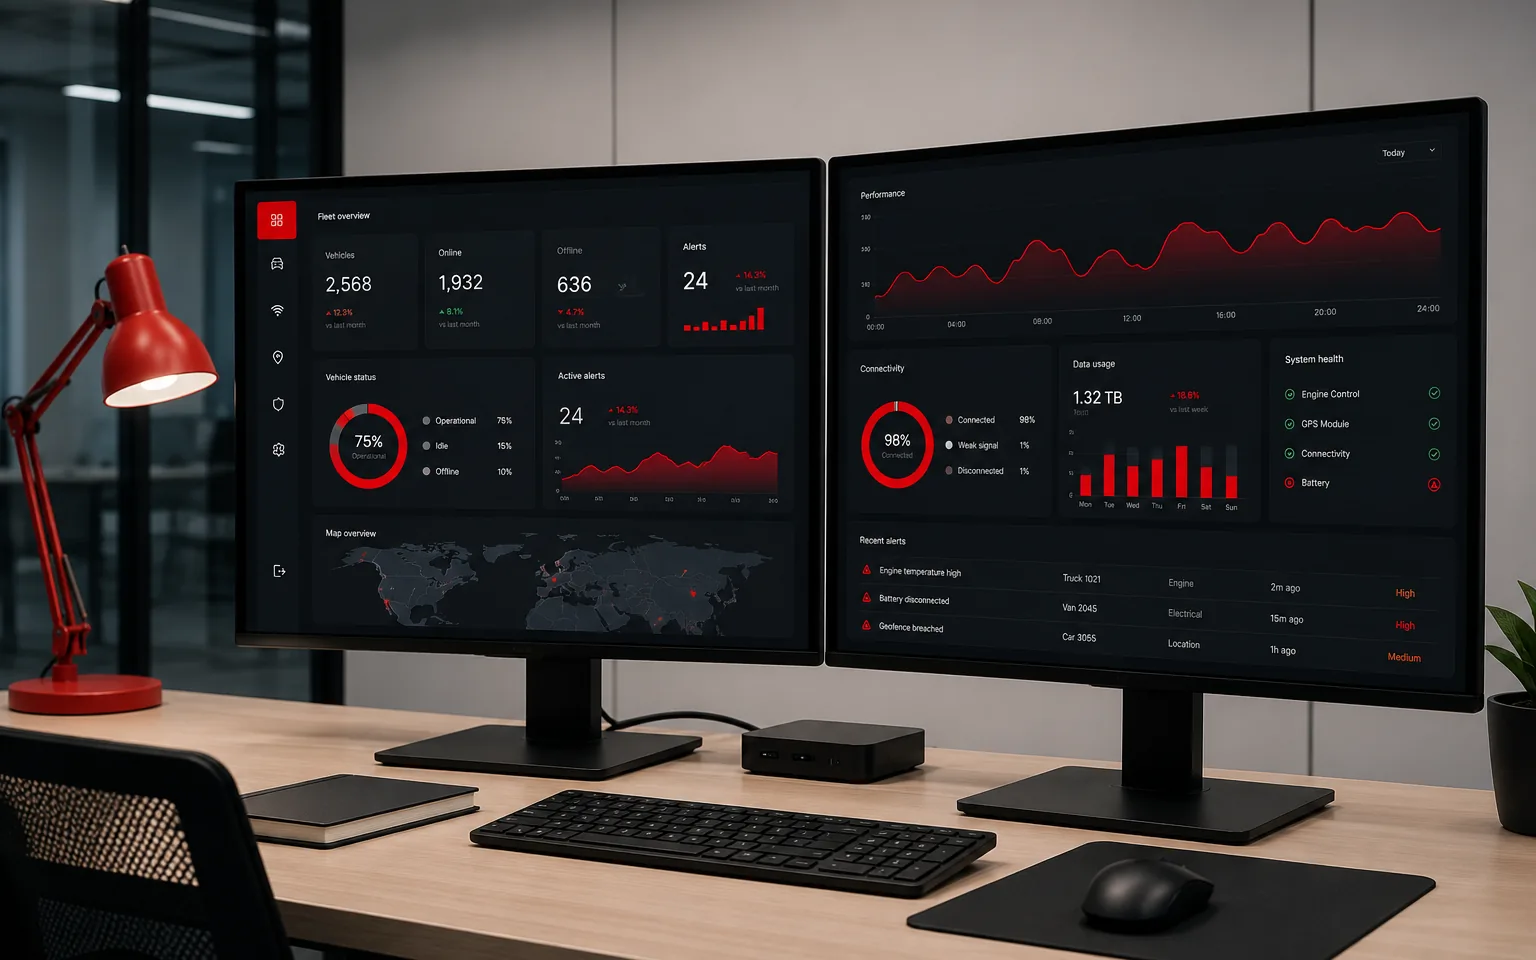
Aspecta designed and implemented a complete solution in the form of a dedicated Grafana dashboard. The dashboard was designed to give a coherent view of the status and availability of VWGS services, accounting for complex inputs and dependencies between systems.
The main capabilities of the solution:
- Service status visualization: the dashboard gives an intuitive, color-coded view of the current state of every monitored service, so problem areas can be spotted immediately.
- Dependency tracking: the system shows how services are connected, so the potential impact of an outage in any one component can be determined quickly.
- Real-time updates: information on service status and on progress in resolving incidents is updated in real time, so everyone involved always has current information.
- Intelligent incident classification: a system for more accurate categorization of incidents was implemented, which helps reduce the number of incorrectly escalated problems.
- Monitoring tool integration: the solution brings together data from several sources, including Kibana, Grafana, Smile, Dynatrace, Splunk, and Elastic, for a complete view of the infrastructure.
- Extended monitoring: the system was extended to cover external platforms and services, including AWS and Concourse, giving better visibility of and control over these critical components.
- Proactive notifications: an alerting system was implemented that automatically informs the relevant teams about potential problems before they affect services.
The technical solution was designed for scalability and flexibility, so new services can be added easily and monitoring parameters adjusted as the needs of VWGS change.
Challenges and how they were overcome
During the implementation, the Aspecta team came up against several challenges:
- Integrating heterogeneous systems: one of the main challenges was bringing data from different monitoring tools into a single dashboard. The team had to build sophisticated connectors and transformation processes to keep the displayed data consistent and reliable.
- Classifying incidents correctly: building an accurate incident classification system required close cooperation with the VWGS Level 1 support team. Historical data had to be analyzed and clear criteria defined for each severity level.
- Keeping real-time data accurate: displaying current service status in real time was demanding in terms of system performance and reliability. The team implemented advanced caching and optimized the data flows to keep the dashboard responsive.
- Complex dependencies between services: mapping and visualizing the relationships between the various services and systems required a sophisticated dependency model. The team used graph databases to represent and analyze these relationships efficiently.
- User adoption: introducing a new system meant changing established ways of working. The Aspecta team ran a series of training sessions and produced detailed documentation to ease the transition.
These challenges were overcome through close cooperation between the Aspecta and VWGS teams, an iterative approach to development, and thorough testing under real conditions.
Results
The new monitoring dashboard brought VWGS significant improvements in IT service management:
- Better visibility: management gained an immediate view of the state of critical services, which made decisions faster and better informed.
- More effective incident resolution: more accurate classification and faster problem identification substantially shortened the time needed to resolve incidents.
- A proactive approach: the system made it possible to detect potential problems early, which reduced the number of unplanned service outages.
- Resource optimization: better incident routing and fewer incorrect escalations led to more efficient use of people.
- Better collaboration: the centralized dashboard improved communication and cooperation between the various IT teams.
- Broader control: integrating the monitoring of external services gave VWGS better control over the entire IT infrastructure.

Precise quantitative figures are not available, but VWGS recorded a marked improvement in key performance indicators such as incident resolution time and overall service availability.
Conclusion
The advanced monitoring dashboard is a significant milestone in the digital transformation of VWGS. The project solved pressing problems with visibility and IT service management, and it laid the groundwork for further innovation and improvement.
The key to its success was the ability of the solution to integrate different data sources and provide a single, easily understood view of a complex IT infrastructure. This allowed VWGS to move from a reactive to a proactive approach in managing IT services.
The long-term benefits include not only better operational efficiency but higher customer satisfaction, thanks to more reliable and more stable services. VWGS is now better prepared to meet future IT challenges and to support innovation across the whole Volkswagen group.
The project shows how the strategic implementation of advanced monitoring tools can transform IT operations in large organizations and deliver measurable business benefits.